


USD/JPY has spent nearly three years trapped in one of the cleanest macro ranges in the FX market, and the pair has just delivered us back to the top of it. Price is pressing the 158–160 zone again — the same shelf where the Bank of Japan has repeatedly drawn its line in the sand — and the weekly chart is starting to line up a cluster of signals that, taken together, make this an asymmetric spot to start building short.
This is not a call that the multi-decade uptrend is over. The structural picture remains yen-negative: the Fed sits at 3.50–3.75%, the BoJ at 0.75%, and that ~300bp differential keeps the carry trade pulling buyers in on every dip. Tokyo has spent something in the order of ¥10 trillion since late April defending the yen, on top of the ¥15 trillion deployed across 2024, and price is right back where it started each time. Intervention buys time; it has not reversed the trend. So what we are setting up here is a cyclical, mean-reversion short within a structurally bullish backdrop — a counter-trend trade that needs the cycle, the levels, and a catalyst to line up. The good news is that, for the first time in a while, they are starting to.
The macro backdrop: a predictable range
The frame for everything below is simple. USD/JPY has traded inside a well-defined range since July 2023 — roughly 140 on the floor, 160–162 on the ceiling, with the 150 range equilibrium acting as the magnet in the middle. The behaviour inside that range has been notably cyclical, which is precisely what makes a timing-and-levels approach viable here rather than the usual “fade the intervention zone and pray” trade.
The 160–162 ceiling is not just a psychological round number. It is where Tokyo has physically acted, where the carry trade violently unwound in August 2024, and where every prior rejection has originated. We are testing it again.
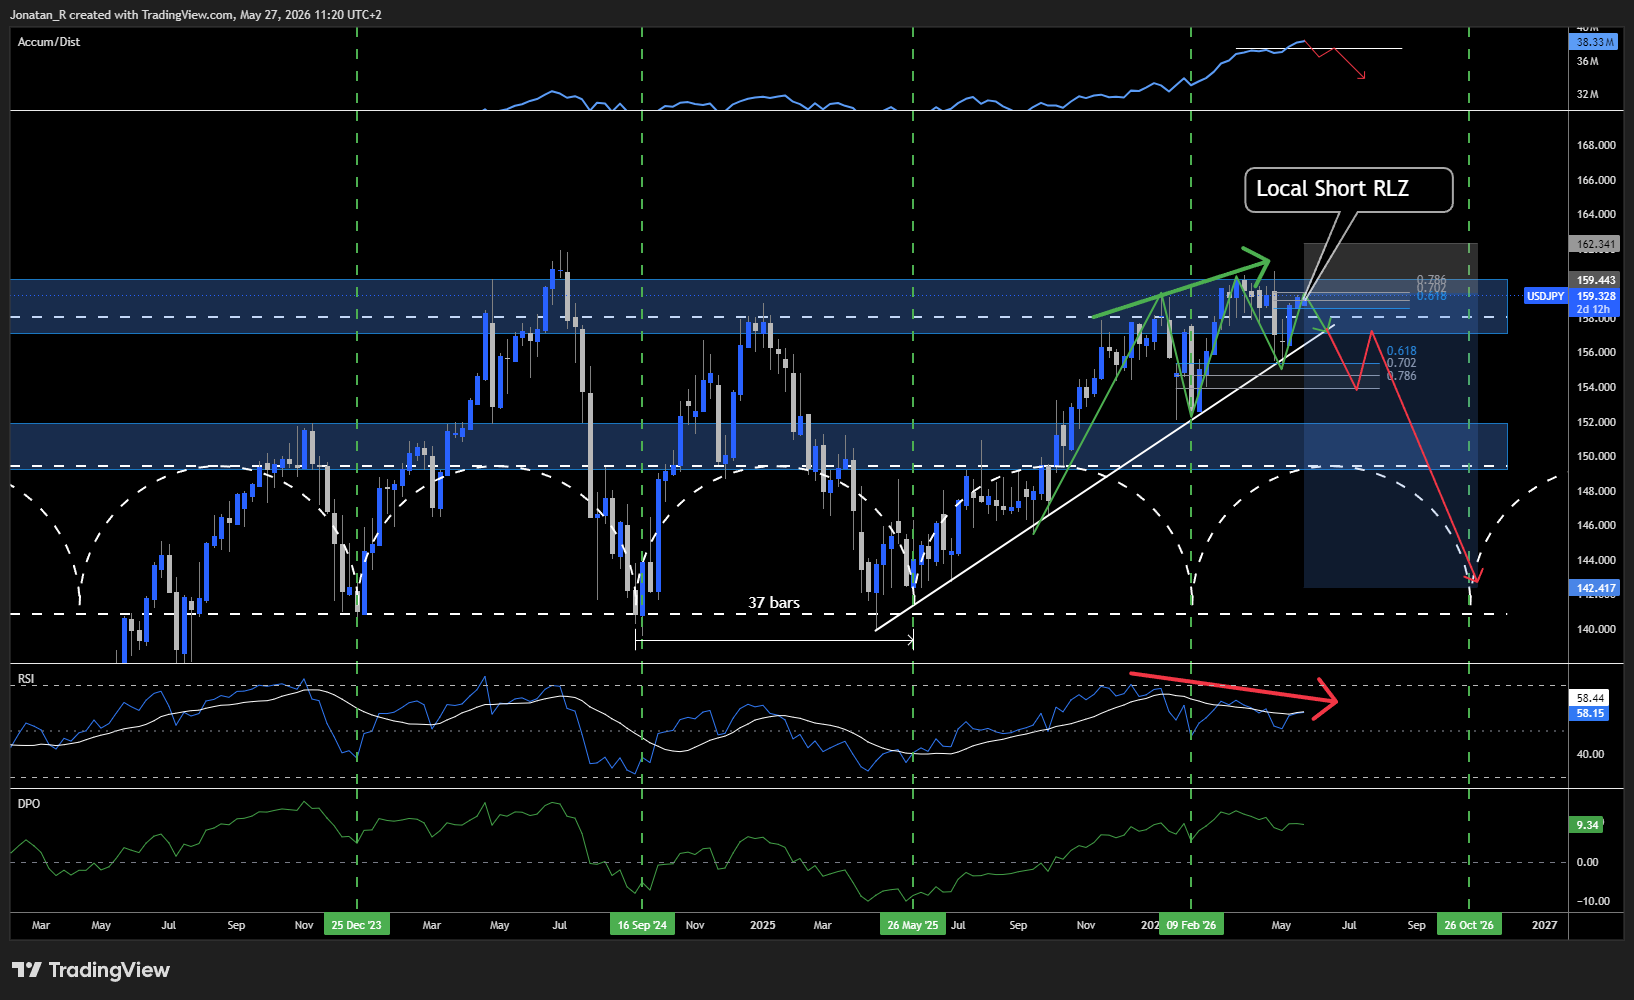
Weekly momentum is diverging
The first crack is in momentum. The weekly RSI is printing a bearish divergence: price is grinding to higher highs into resistance while RSI makes lower highs. Importantly, RSI is still holding above the 50 level — so this is a warning, not a confirmation. Momentum is being eroded, not broken. That distinction matters, and it is the reason we are scaling in rather than going all-in at the highs.
The local trend on the weekly is still bullish. We recently bounced off the local long RLZ around 4 May near 155, and that bounce is what has carried us back up to retest resistance. So we are respecting a structure that is, for now, still pointing up — while positioning for the rotation we think is coming.
The setup: testing the local short RLZ
Price is now testing the local short reload zone of the most recent local down move, sitting in the 159–162 band against the 0.618 / 0.702 / 0.786 retracement cluster. This is the same shelf that aligns with the broader range ceiling and the intervention zone — a genuine confluence of local and structural resistance.
Because there is no significant confirmation yet, the position is deliberately not fully filled. We are building into strength at a level we expect to reject, with the bulk of the size reserved for confirmation rather than committed on hope.
Time cycles point to an October low
This is where the chart gets interesting. Mapping the dominant cycle (the white dotted arcs), the rhythm has been strikingly regular — and it projects the next major cycle low around October 2026.
That timing is not happening in a vacuum. October 2026 is a window we have been circling across multiple assets in the Clarity Edge framework, including Bitcoin, which our cross-asset timing work has pointed toward a bottom in the same period. When an FX pair and a risk asset that move on related liquidity dynamics both project lows into the same window, that confluence is worth weighting. It is the kind of cross-market timing alignment that rarely shows up cleanly and is hard to ignore when it does.
DPO: the cycle is topping
To measure the cycle objectively rather than by eye, I have the Detrended Price Oscillator set to a length of 37 — derived from the September 2024 low to the May 2025 low, measured trough-to-trough as one complete rotation. That ~37-week cadence is what the vertical cycle markers are built on, and it has held remarkably well across the prior turns.
With the trend stripped out, the DPO is currently sitting at a high — exactly the part of the cycle where a top tends to form. So the oscillator is corroborating what the time arcs imply: we are late in the up-phase of the dominant cycle, in the zone where the next rotation lower should begin.
Accumulation/Distribution is the missing confirmation
The one indicator still firmly against the short is Accumulation/Distribution, which remains in a clean, unbroken weekly uptrend. Buying pressure is still dominant. This is the signal I most want to see roll over before treating the top as confirmed.
The practical catch: a weekly A/D breakdown will most likely only materialise once price breaks below 156 — and by then, a chunk of the move is already behind us, making it a late entry. That is the core tension of this trade. Confirmation and price are in conflict: wait for the clean signal and you give up edge; lean in early and you are fading a trend that is still technically intact. We resolve it by doing both — a starter position into the RLZ now, the balance added on the 156 break and A/D rollover.
The catalyst
Cycles and levels set the table, but counter-trend FX reversals need a fundamental trigger, because intervention alone has not held. The most concrete near-term catalyst is the BoJ meeting on 15–16 June. A hawkish surprise or an actual hike would narrow the differential and could ignite a carry-trade unwind — the August 2024 playbook, when a BoJ hike sent the Nikkei down 12% in a single session as leveraged positions blew out. The energy-driven inflation from the Iran conflict is what keeps that hike on the table. That is the fundamental engine that could power the cyclical top into an actual move.
The trade
Bias: Short USD/JPY — cyclical, counter-trend, within a structurally bullish range
Entry: Scaling in at the local short RLZ (159–162); balance added on a weekly break below 156 with A/D confirmation
First target: Range EQ around 150 — take partial profit and secure the trade here
Cycle target: ~142 into the projected October 2026 cycle low
Hold: ~20–30 weeks, consistent with the cycle timing into Q4 2026
Total risk: 5% of portfolio
Invalidation: A weekly close above the 160–162 intervention ceiling. A confirmed break of the range highs reopens multi-decade highs and kills the cyclical thesis — at that point the carry trade has won the round and we stand aside.
Bottom line
We have momentum divergence, a local and structural resistance confluence, a cycle measured by DPO that is topping, and time arcs projecting a low into October 2026 that lines up with our broader cross-asset timing — including Bitcoin. The one holdout is Accumulation/Distribution, which keeps us disciplined: starter size now, full conviction on the 156 break. With the BoJ on 15–16 June as the live catalyst, the risk/reward of beginning to build short here, against a clearly defined invalidation above 162, is the kind of asymmetry worth acting on.
This is positioning commentary for the Clarity Edge community, not personal investment advice. Trade your own plan and manage your own risk.