


Bitcoin has broken into uncharted territory once again, closing its highest weekly candle in history. This milestone comes after a strong breakout, confirming the dominance of the primary trend. With this, it is the perfect time to revisit the higher time frames and examine where Bitcoin stands and what key levels might define the next moves.
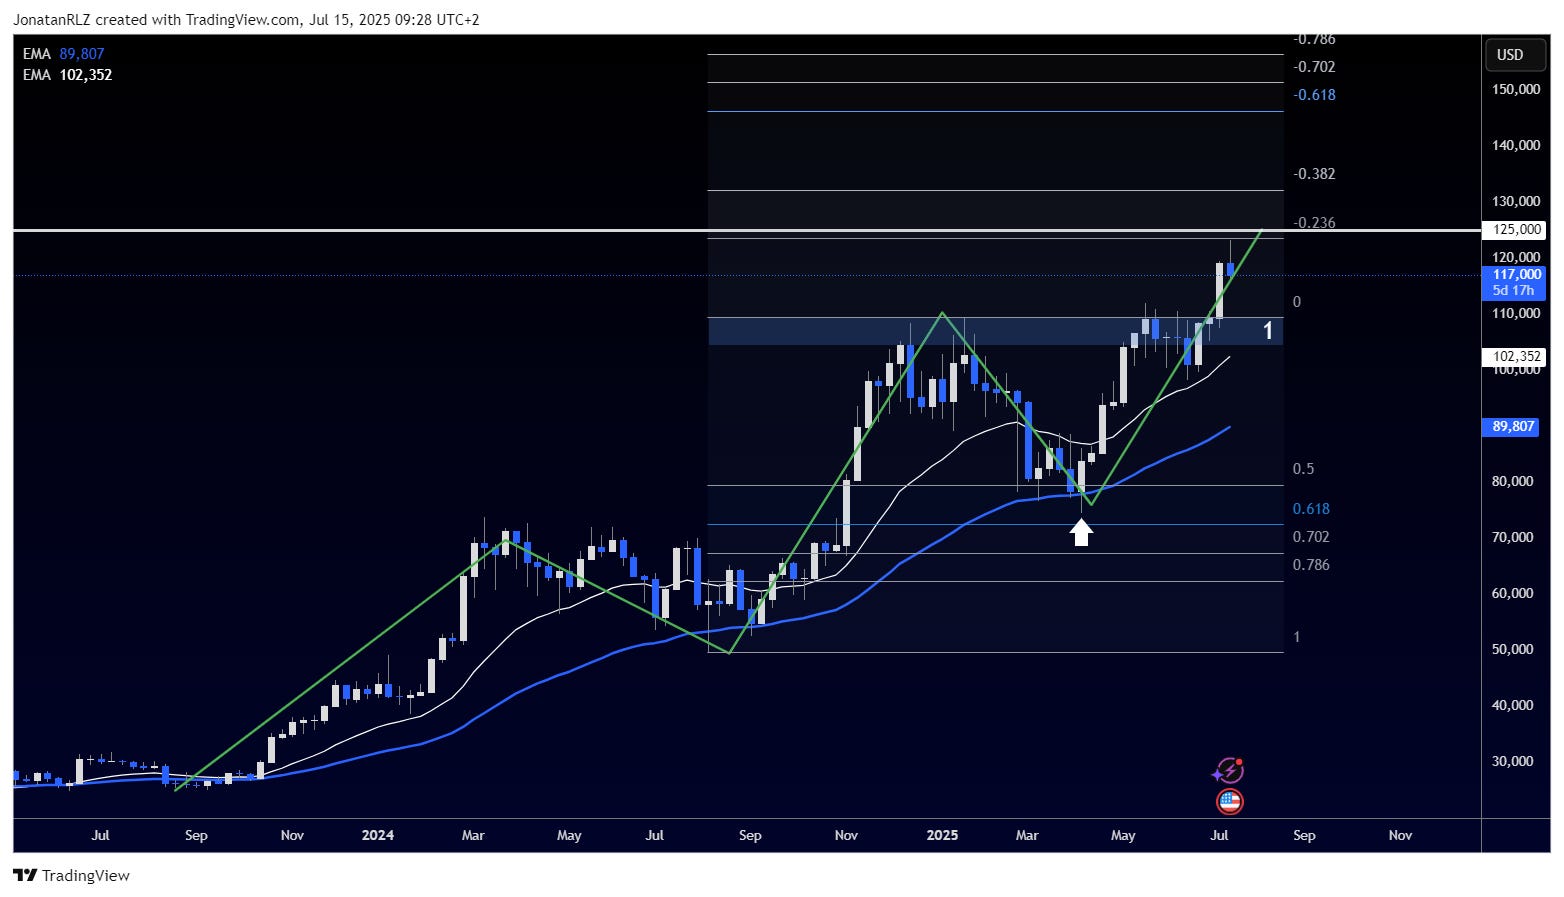
Looking at the weekly chart, the primary trend remains firmly bullish, characterised by a series of higher highs and higher lows. The 20 weekly EMA (white) and 50 weekly EMA (blue) continue to slope upwards, providing dynamic support. Historically, Bitcoin has often bounced in the area between these two EMAs during pullbacks, creating new higher lows before continuing its trend.
Adding Fibonacci retracement levels from the August 2024 low to the January 2025 high, we see that price recently bounced cleanly at the 50 percent retracement. This zone, which also aligned with the weekly 50 EMA, produced a bullish engulfing candle on the weekly chart, a strong technical signal marked with a white up arrow on the chart.
The current breakout has since extended to the -0.236 Fibonacci extension level, where price met initial resistance. The -0.236 extension comes in slightly below the 125,000 region, suggesting this area could act as a key level to monitor. A break above 125,000 might open the door to a push toward the -0.382 level, but a rejection there would not be surprising given its alignment with a Fibonacci confluence zone.
In the event of a deeper retracement, the breakout level around 110,000 marked with number one on the chart becomes an important support zone to watch. Additionally, the previous all time high area near 112,000 remains a probable support level where bulls may step in to defend the broader structure.
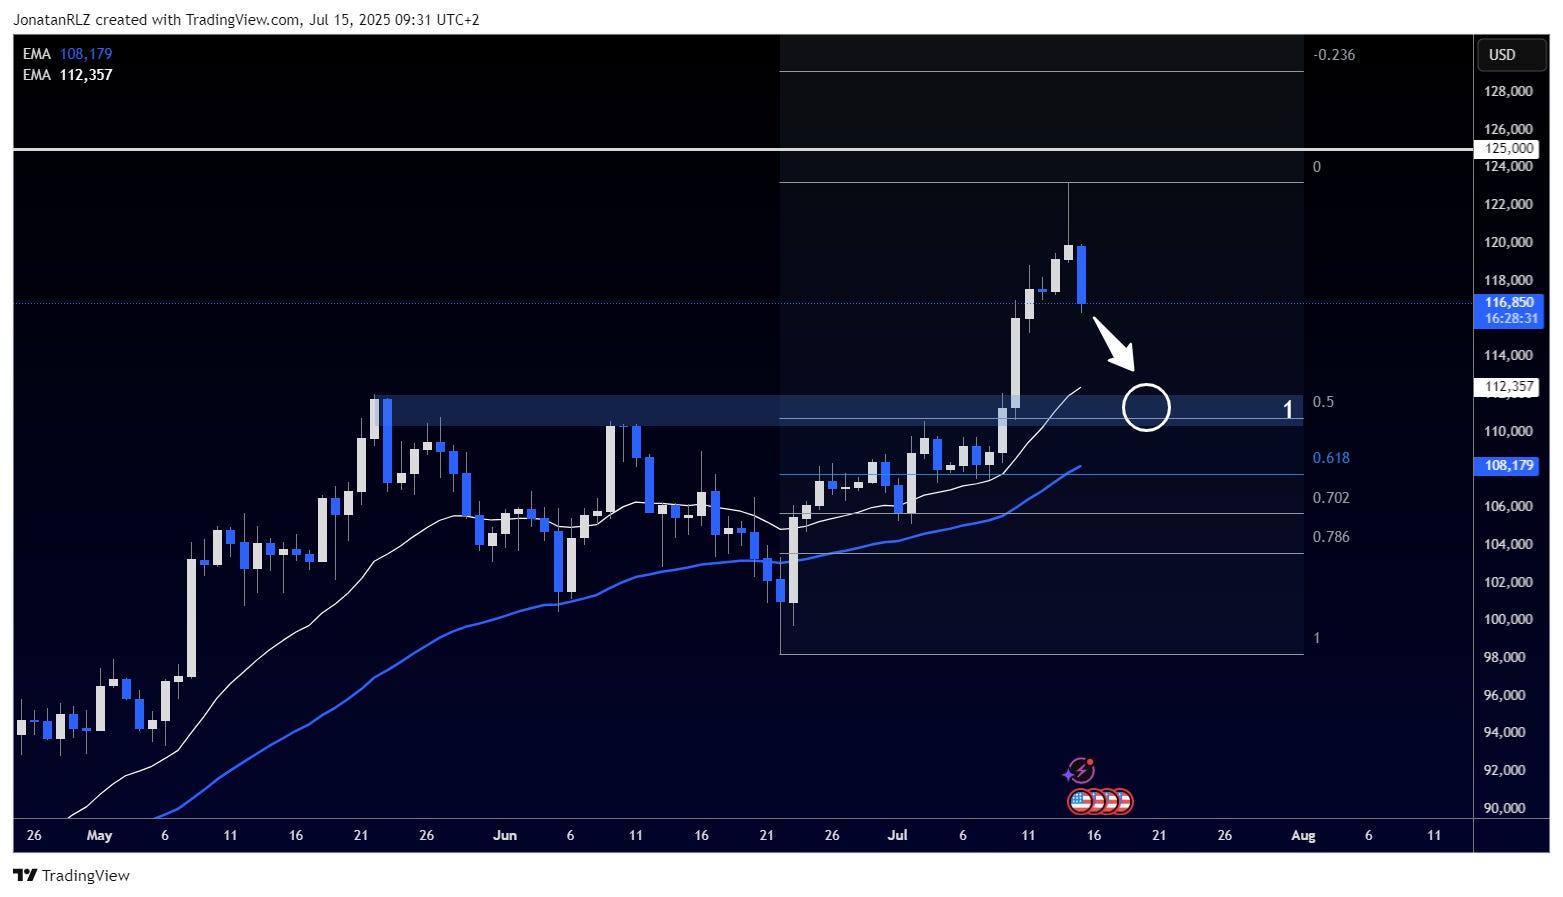
Zooming into the daily chart, we can see further technical alignment. By applying the Fibonacci retracement from the 98,000 low to the current breakout high, the 50 percent retracement level aligns closely with the breakout zone. The daily 20 EMA is already in this area, and over the coming days, we expect the 20 and 50 EMAs to converge closer, creating a zone of confluence. This overlap could act as a strong support if price pulls back.
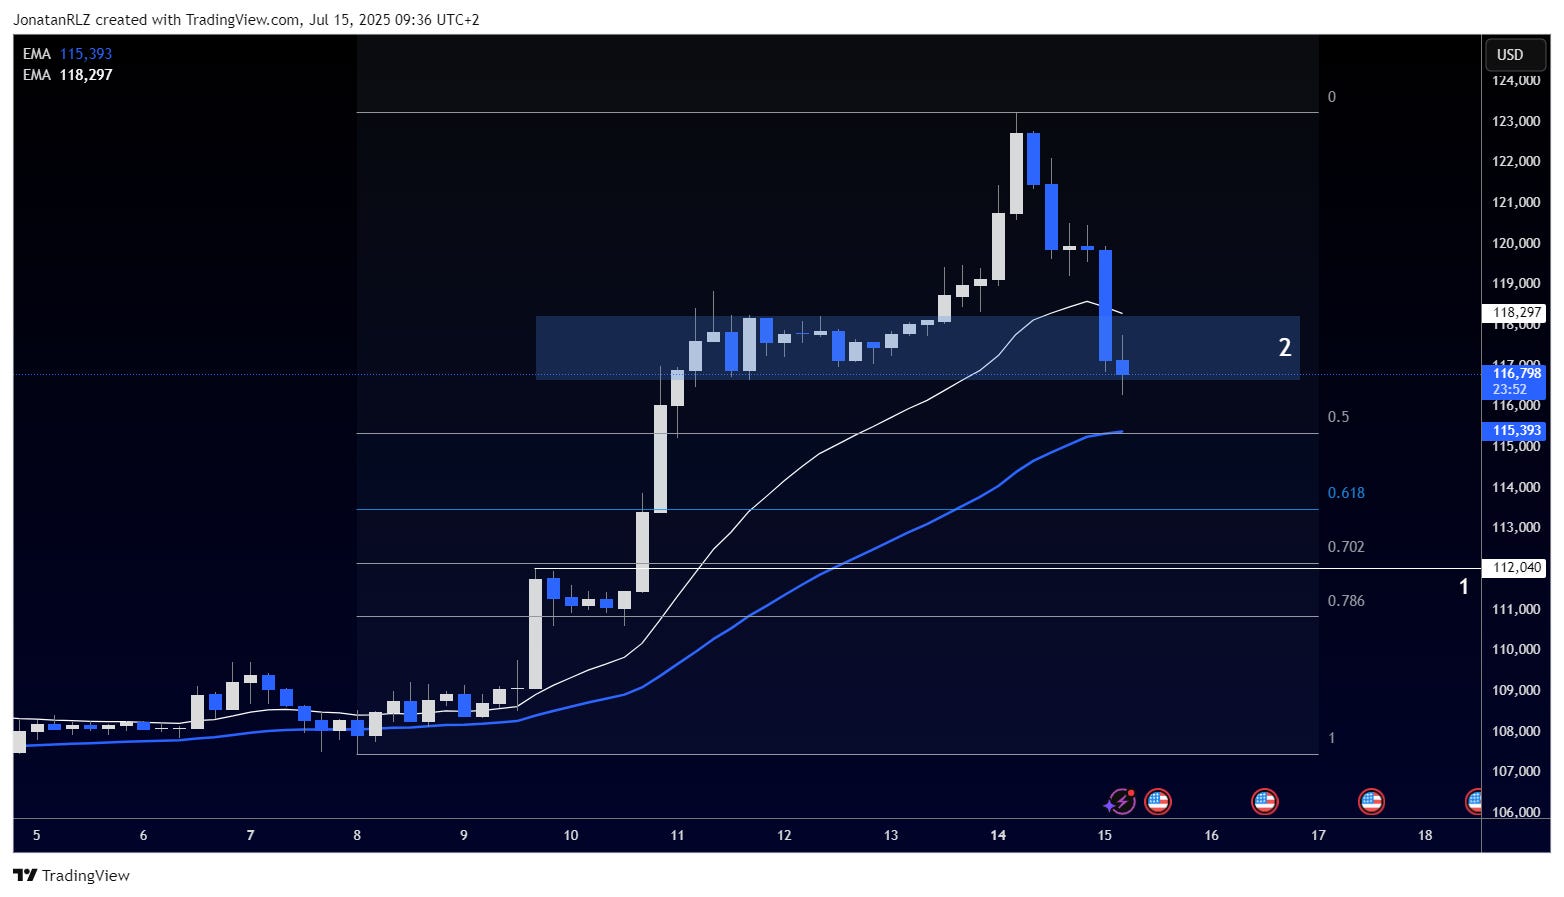
On the 4-hour chart, two levels of interest emerge. The first is marked as number one, aligning with the mid-zone of the Fibonacci reload zone (0.702 level) and the previous all time high area. This level could serve as support if price pulls back, possibly front running the higher time frame breakout zone. The second level marked as number two becomes key if price rebounds higher. A reclaim of this level could signal local strength and continuation of the bullish trend. Conversely, if price drops and fails to reclaim it, the area may act as resistance on any lower timeframe bounces.
For now, holding support near 112,000 would indicate local strength, while the 117,000 to 118,000 area remains an important horizontal zone to monitor, especially if price begins to retrace deeper.