


Today I wanted to share with you three ideas I’m watching for the week, and also tell you about an exciting announcement.
I’ve recently paired together with a group of traders in a collective called Pathway to Prop. It’s a completely free community where I’ll be sharing all the setups I’m taking, along with my day-to-day updates and market thoughts.
👉 Make sure you join the Telegram below for direct access.
AUDNZD – Breakout or Fakeout?
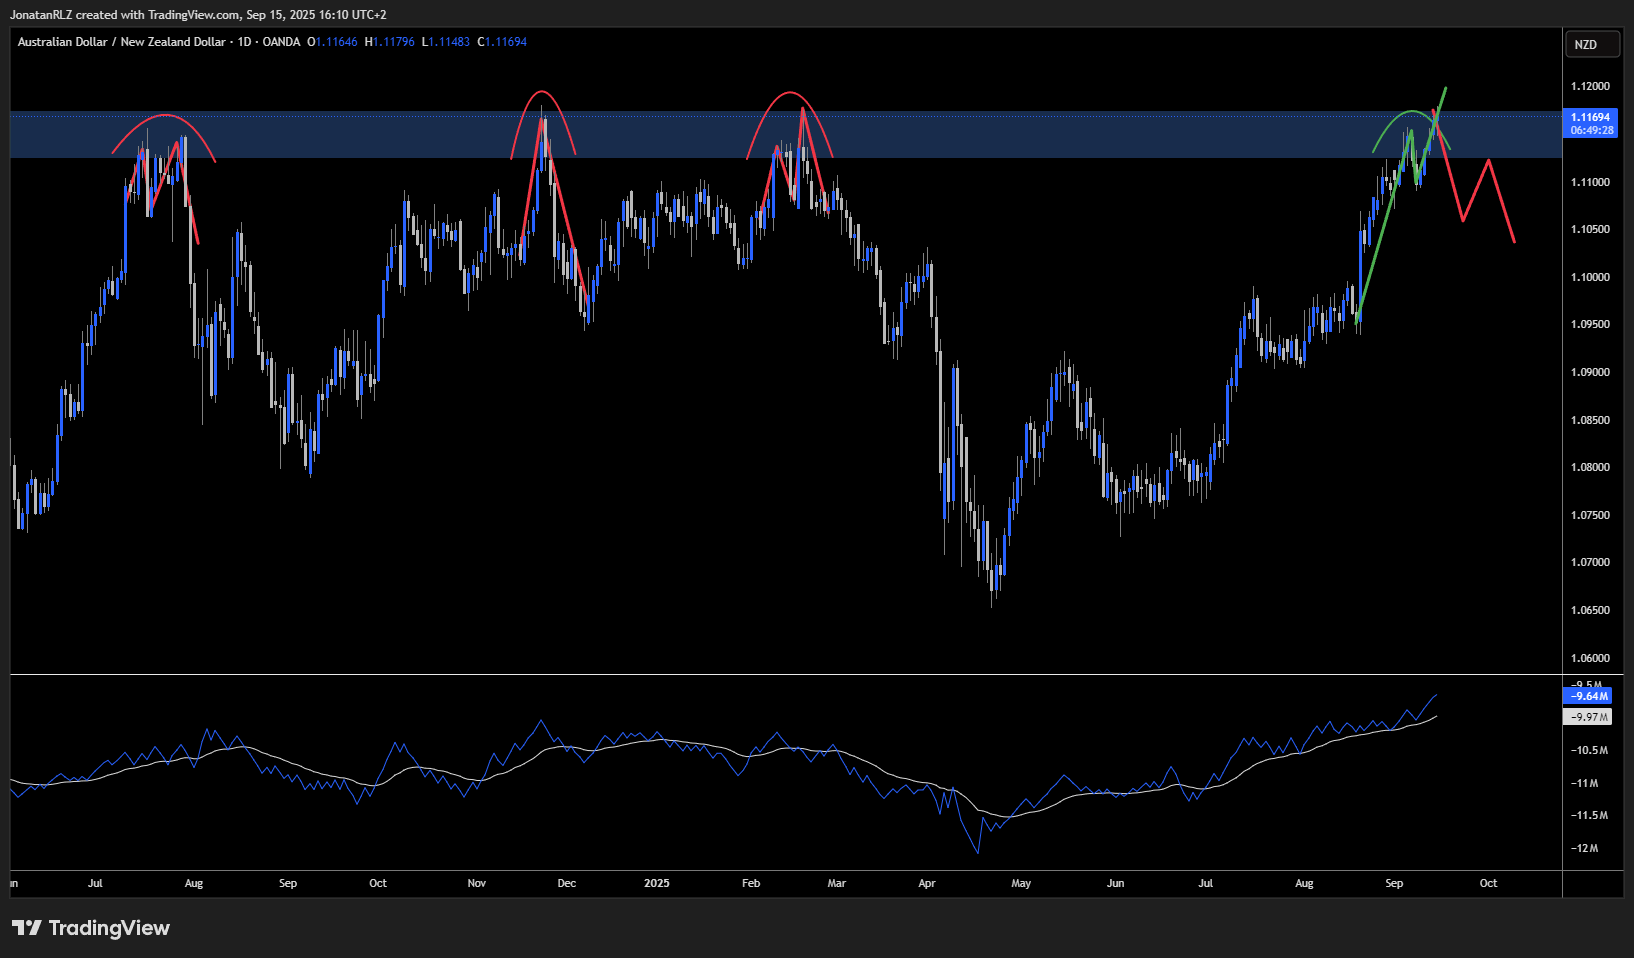
AUDNZD reecntly closed its highest weekly close since November 2024, with momentum carrying into the start of this week.
This leaves us with the classic question:
👉 Is this the start of a sustained breakout?
👉 Or another opportunity for mean reversion?
The case for the breakout:
Trend-followers see strong local trend, bullish momentum, and higher closes suggesting buyers are in control. And a change in price behavior compared to other touches of this resistance level.
The case for mean reversion:
For over three years, price has failed to break this higher timeframe resistance zone. Each test has ended in rejection. The question is, what are the odds that this time is different?
What to watch:
Local price structure — does behavior look different compared to previous tests of this resistance?
Volume — slightly higher, but no major divergence or clear confirmation.
OBV — here we do see a breakout. OBV strength, combined with changing price behavior, could be the strongest sign yet that this resistance may finally give way.
In short, AUDNZD is at a crossroads. If price confirms what OBV is already signaling, bulls may have the edge. If not, this could be yet another false breakout.
GBPCHF – Bounce Potential
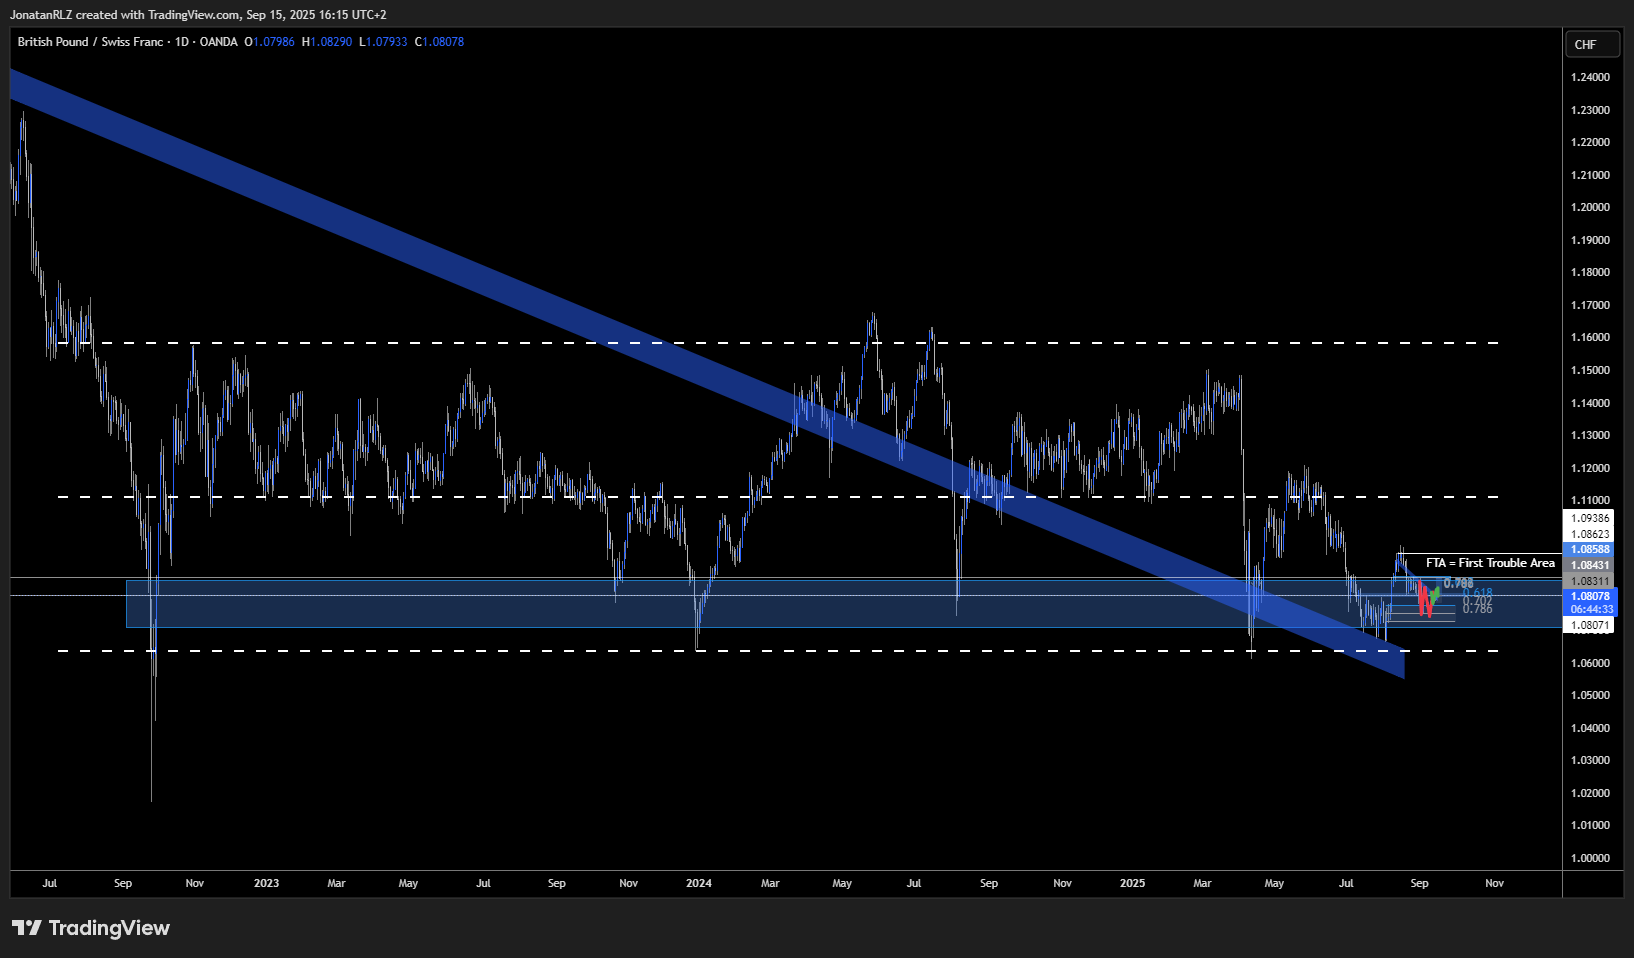
Turning to GBPCHF, the daily chart shows price trading at the very low of its current range. Historically, GBPCHF seldom moves much lower than this level, and when price does reach here, it often produces a bounce.
So, while the local structure might still look bearish, the context suggests we should watch for a potential bounce from current levels.
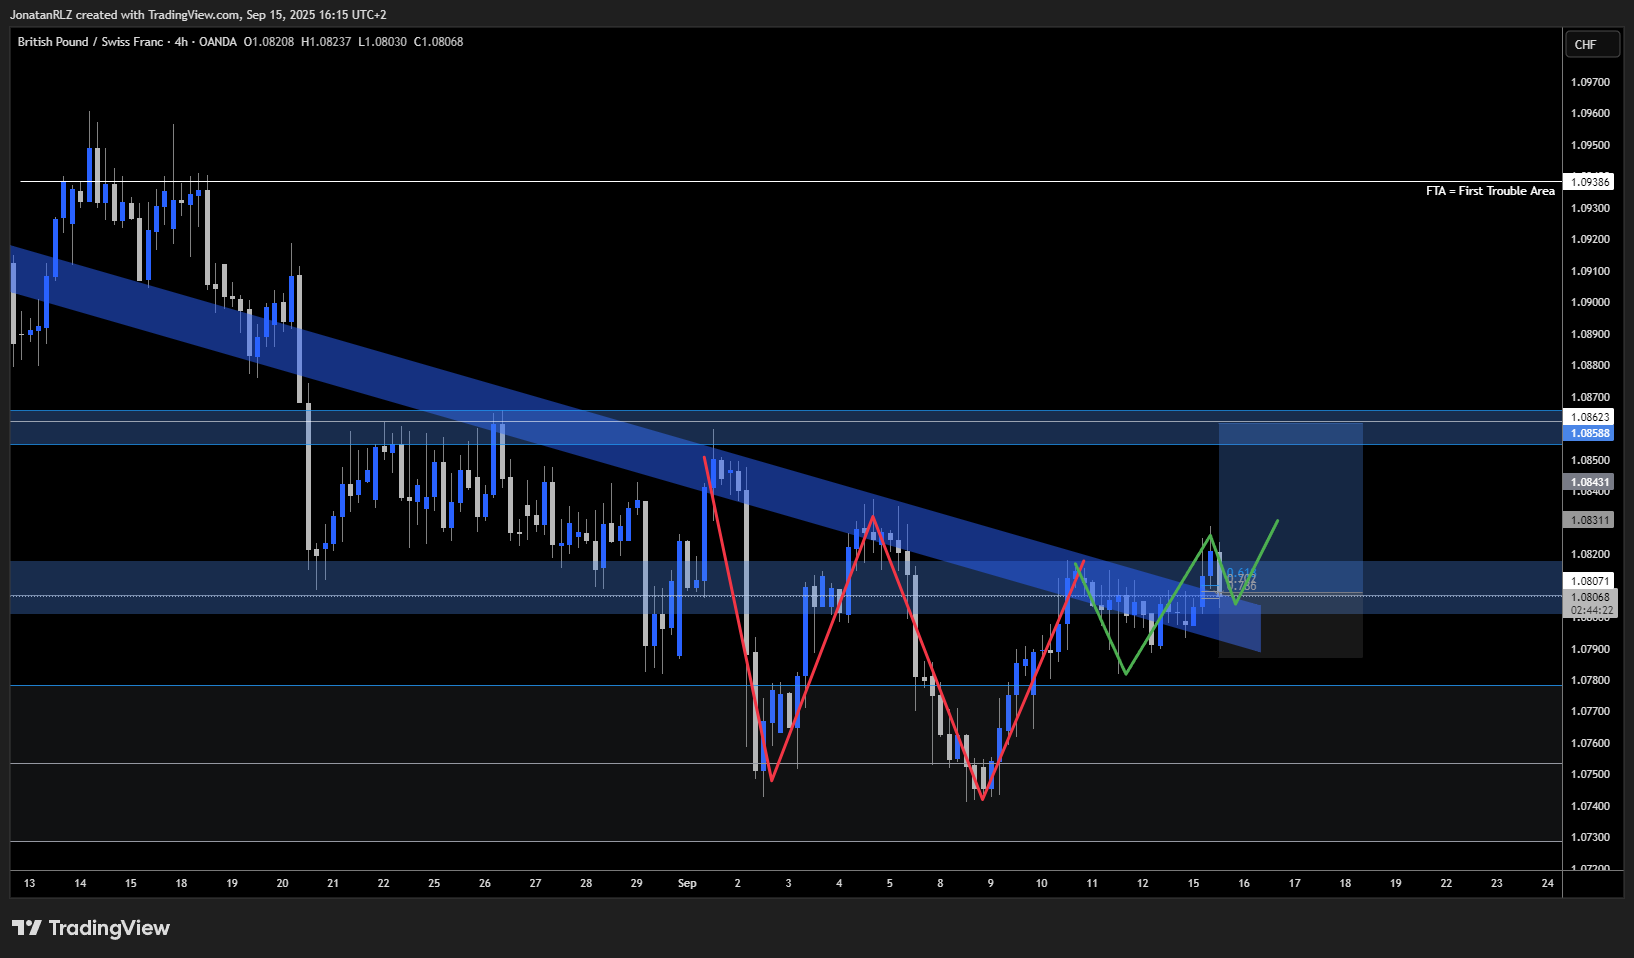
On the 4H chart, we see further supporting evidence:
Price has recently broken above a descending trendline.
We are currently seeing a break and retest of that same trendline.
Structure has also shifted, illustrated by the red lines on the chart turning green.
Because the overall structure remains slightly bearish, I’m keeping targets conservative. A bounce of around 50–60 pips looks reasonable, with a target at 1.0860.
GBPNZD – Break and Retest with Inverted H&S
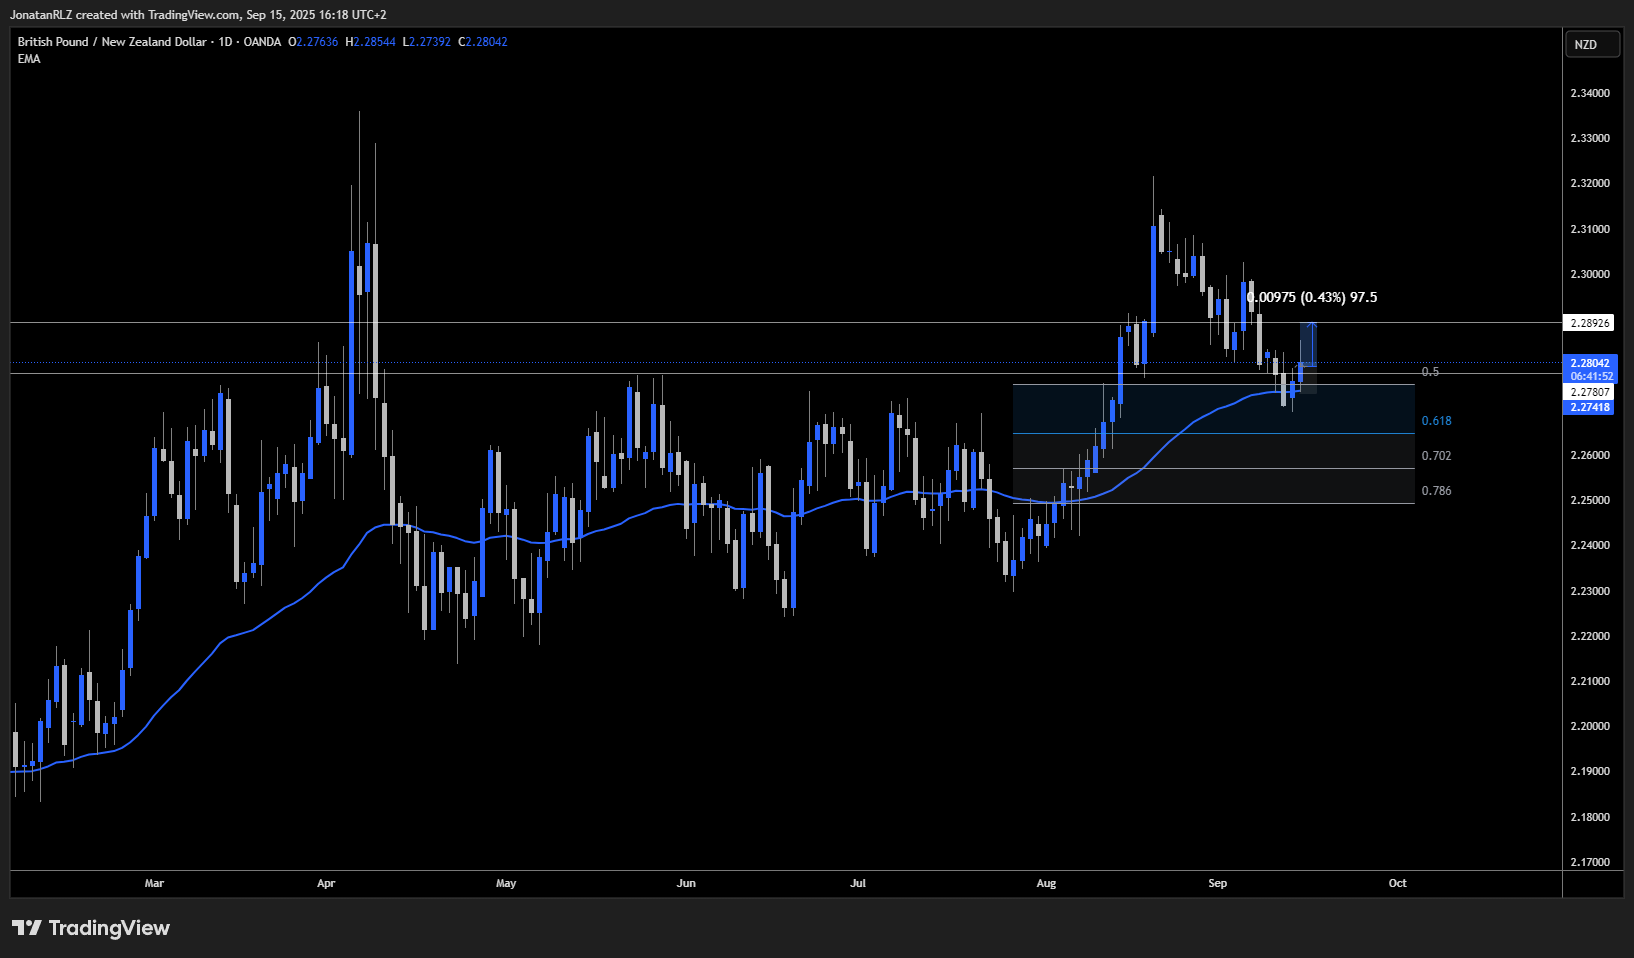
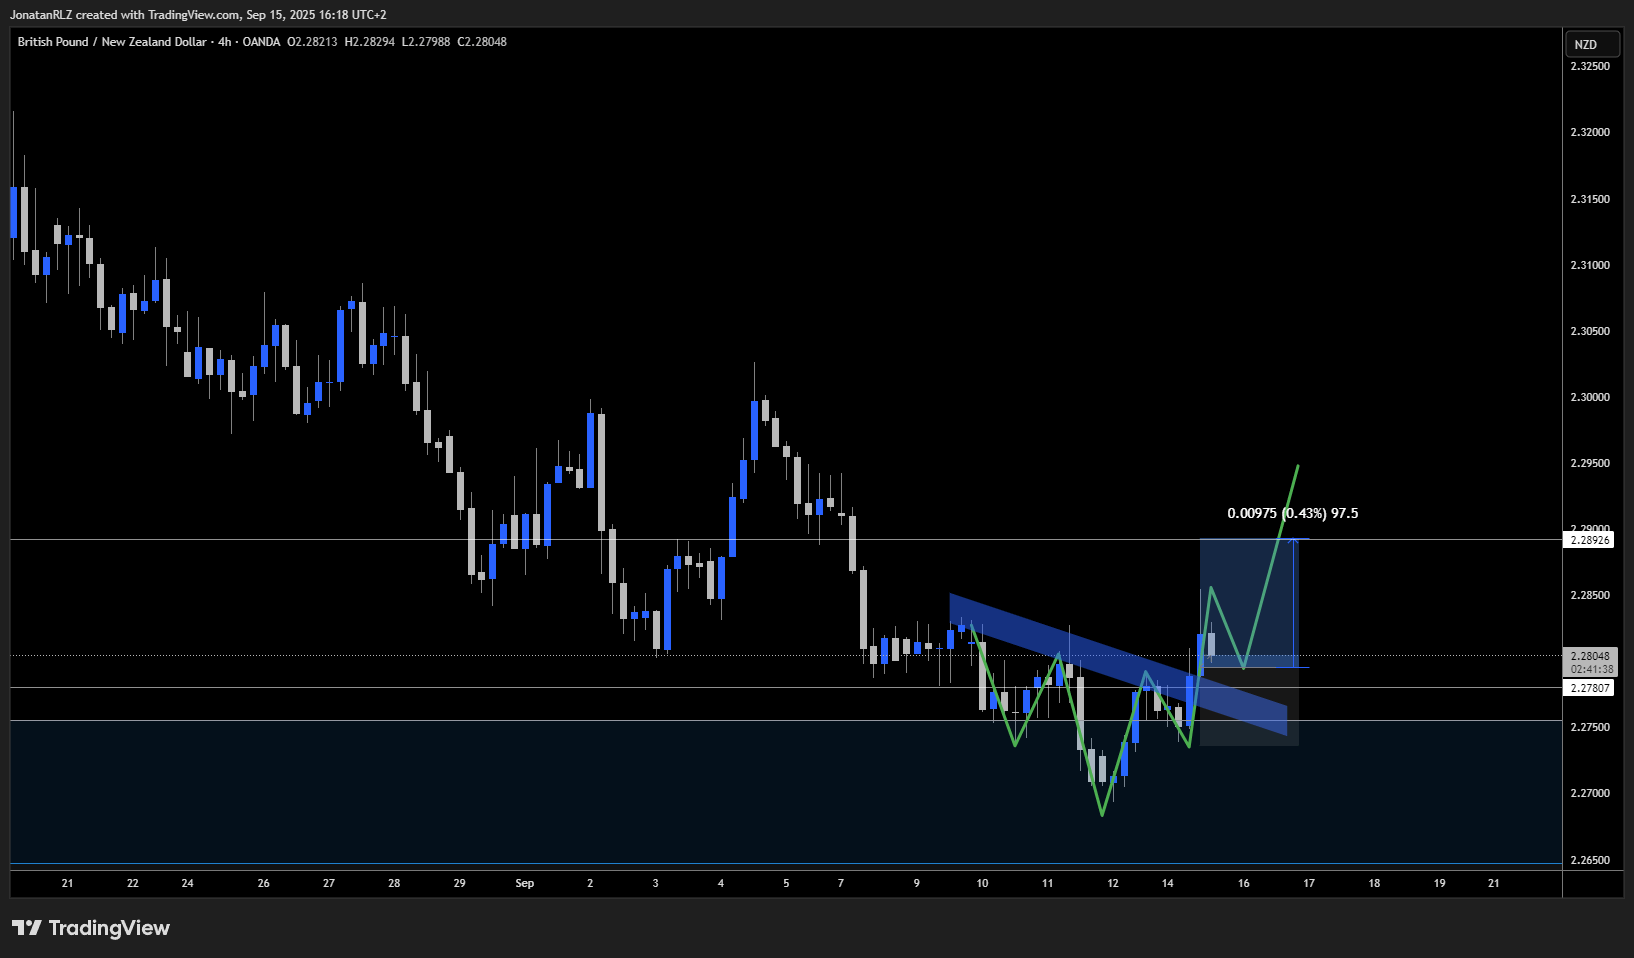
On the daily chart, GBPNZD shows a clear break and retest of structure.
Zooming into the lower timeframes, that same break and retest is visible and confirmed.
On the 4H chart, we also see an inverted head and shoulders pattern forming against a descending trendline. A potential retest of that area would validate an entry.
Using the measured move rule for the head and shoulders pattern, the setup points to a potential upside move of about 100 pips, with targets around 2.2900.